USDA planting zones recently changed, but Maine farmers already adapting
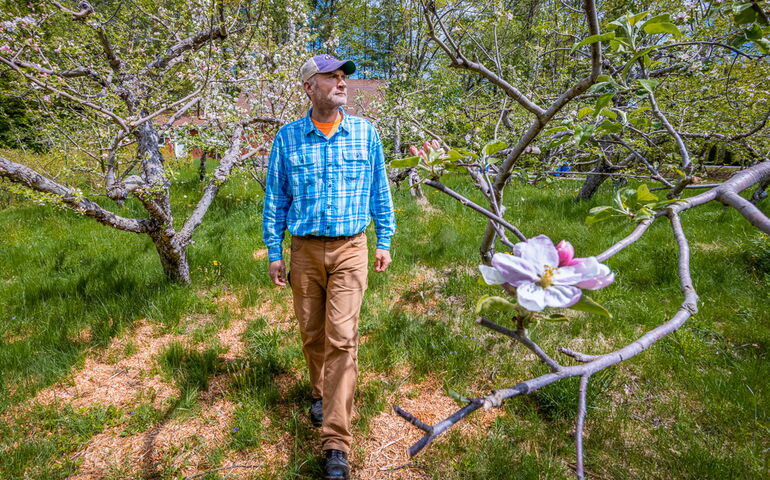 Photo / Tim Greenway
Shane Patrick, the owner of Pleasant Pond Orchard in Richmond, says in jest that climate change has made it easier for him to enjoy Maine-grown peaches.
Photo / Tim Greenway
Shane Patrick, the owner of Pleasant Pond Orchard in Richmond, says in jest that climate change has made it easier for him to enjoy Maine-grown peaches.
The latest version of the U.S. Department of Agriculture’s plant hardiness map illustrates a notably warmer shift in Maine’s coldest extreme minimum temperature since the last published update in 2012.
While that might not be news to Maine farmers, the data helps in more intrinsic ways, observers suggest.
Shane Patrick, the owner of Pleasant Pond Orchard in Richmond, jokes that climate change has made it easier for him to enjoy Maine-grown peaches, despite the total loss of the crop last year in the state.
But “if I could have four distinct seasons and not grow peaches in Maine, I’d be OK with that,” says Patrick.
That’s because the changing climate doesn’t hold much benefit for Patrick’s apple orchard. Just last year, he recalls, unprecedented April heat preceded a May cold snap, devastating his apple crop. He says such a harsh May freeze has only happened seven times in Maine.
That destroyed much of his harvest. In a typical year, Patrick, who is on the executive committee of the Maine Pomological Society, estimates his roughly 700 apple trees would typically turn around 2,100 bushels of the fruit.
Instead, the farm “lost basically everything,” only yielding 11 bushels.
Rising temps
About two-thirds of the state has slid to a warmer half zone since that last edition in 2012, according to Christopher Daly, the founding director of Oregon State University’s PRISM Climate Group, which does the actual map update.
Across the state, from Houlton to Augusta to Portland, the map shows numerous ZIP codes that have experienced 3-degree rises in their coldest minimum temperatures between 2012 and 2023. Some ZIP codes notched larger jumps. Cape Elizabeth and Fort Kent, for example, both saw a 5-degree rise over that same time, according to the map.
At first glance, that might not seem like a huge change. But for some growers, it’s enough to shift the winter weather conditions they need for a successful harvest.
Take the maple industry, for example. Sugar maples have “very shallow, very sensitive roots” that require a good, insulating snowpack to protect them from shearing off, according to Jason Lilley, maple industry educator at the University of Maine Cooperative Extension.
“We’re not getting as cold as we have historically, which means we’re having more winter rainfall events, fewer winter snowfall events,” he says. “We aren’t having enough of a protective layer over the soil like we’ve had in the past.”
While another indicator that climate change is progressing as predicted, the information the map’s makers say you should take away from the map is somewhat limited. Daly says it’s only designed to tell readers one thing: what on average the coldest minimum temperature is in a given area, which he notes will only really impact what you do with overwintering perennial plants.
“This map doesn’t tell you anything about how hot it will be in the summer, it doesn’t tell you when to plant, when the last freeze is in the spring,” he says. “All it tells you about is mid-winter cold.”
That doesn’t stop some viewers from trying to squint at the map until they can gauge other useful planting data, like the last chance of freezing springtime temperatures.
For example, Daly points to a “tantalizingly similar pattern” between that temperature and deep winter cold in some zones, but notes there isn’t an actual correlation that planters should rely on.
He recommends instead asking county extension agents and similar experts to understand the local picture, as “there’s not a high-quality, detailed national mapping system that would [provide] information like we have for plant hardiness” because of a lack of consistent federal funding.
The cost of change
Although the map hasn’t been updated in about a decade, Meg Mitchell began noticing signs of a changing climate in Maine back in 2015, when she recalls extended periods of drought seemed more common and signs of spring appeared earlier.
While the plant hardiness map update doesn’t tell Mainer farmers anything new per se, Mitchell says it’s nonetheless important for data to confirm what many have felt. It “really underscores that feeling of unpredictability” that farmers have been experiencing, says Mitchell, the climate smart specialist of the Maine Organic Farmers and Gardeners Association, or MOFGA.
Another benefit of the updated map, Mitchell says, is the reminder it serves for farmers to consider what to plant and how to protect their crops from unpredictable periods of excessive rain or drought. That has meant using protective cultivation methods, like greenhouse growing, to shield crops from capricious conditions.
“I think what folks are realizing is protected culture … is one way to hedge your bets about growing these extended season crops or more warm-loving crops,” she explains.
“Folks are really leaning into having more climate control and moisture control over their crops. What are the more protective ways to take advantage of opportunities of the extended crop season?”
However, the cost of taking such steps can be prohibitive for farmers, Mitchell notes.
“A lot of times we see agriculture as one of the solutions to climate change, and a lot of farmers are expected to do public good at a private cost,” she says. “A lot of these adaptation strategies are not cost-effective immediately, whether it’s changing your style of tillage or installing a windbreak, or ventilation or high tunnels.”
Mainebiz web partners
Most Recent


Most Recent


0 Comments